Adventures in Data: Tackling the TEC Network #3
Sometimes, less is more. Initially, I was all about showcasing every single bus in real-time on the map. Cool, right? But then it hit me – it's a bit of an overload for someone just trying to navigate from point A to point B.
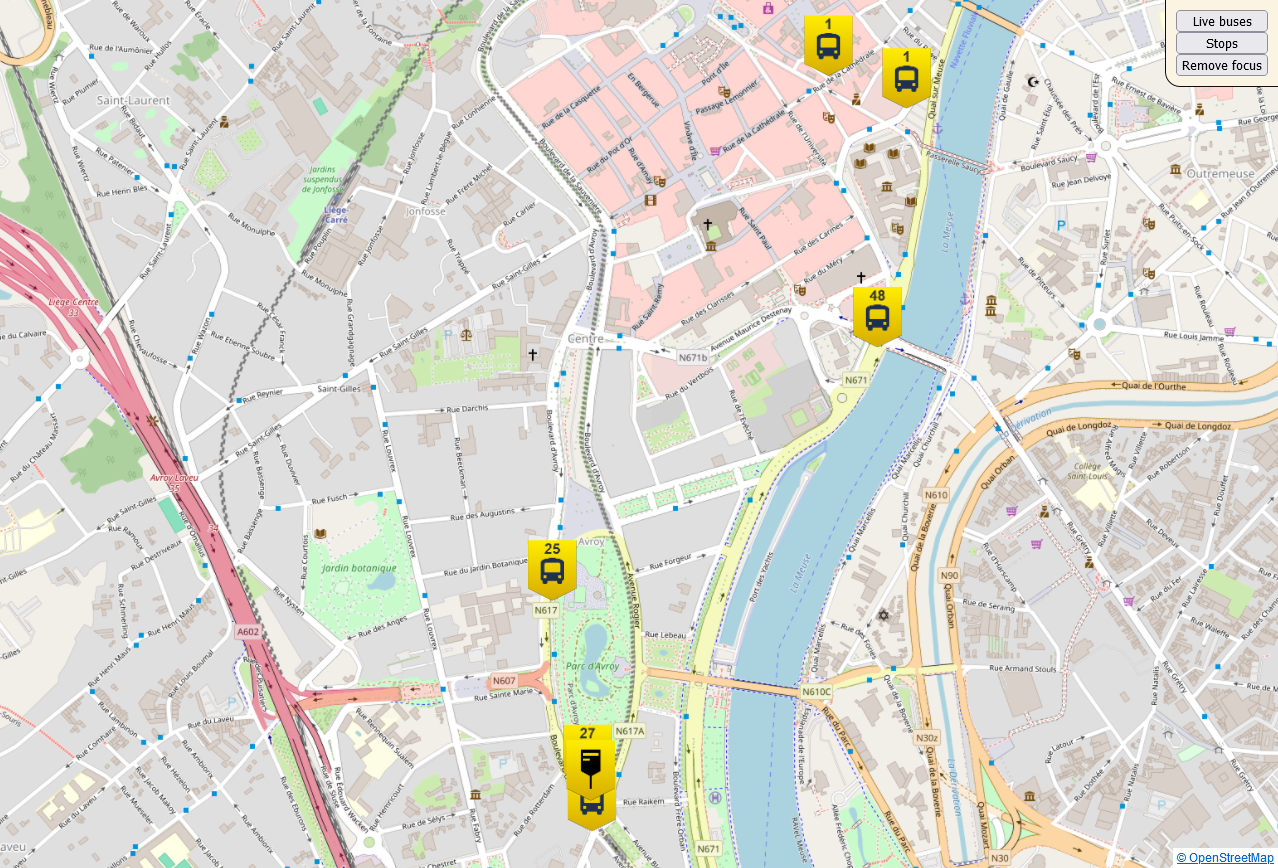
So, here's the twist: I've added a new feature to our digital map. Imagine a tab that, with a single click, sweeps away the clutter of moving buses, leaving only the bus stops. It gets better: Click on a stop, and you'll see a list of buses that are due or have already passed. This way, you're in the know – no more waiting for a bus that's already zipped past your stop.
First Challenge: Displaying the Stops
The Strategy: Initially, one might think of iterating over all stops to see if they fall in the viewport. But, as cool as that sounds, it's not the smartest move efficiency-wise. Remember our first blog?
- Future Thoughts: Sending all the data isn't the most efficient. Perhaps a quadtree approach for just viewport data could cut down transmission load. Food for thought, but not the current focus.
Well, that's precisely what we're implementing. Enter the Quadtree! This data structure is a lifesaver for storing and retrieving data based on spatial location. Implementing it was a bit challenging, but oh, so worth it. We can already be confident that the data isn't clustered and is quite balanced since it's bus stops we're dealing with. Now, we're efficiently sending only the relevant stops to the user with a complexity of
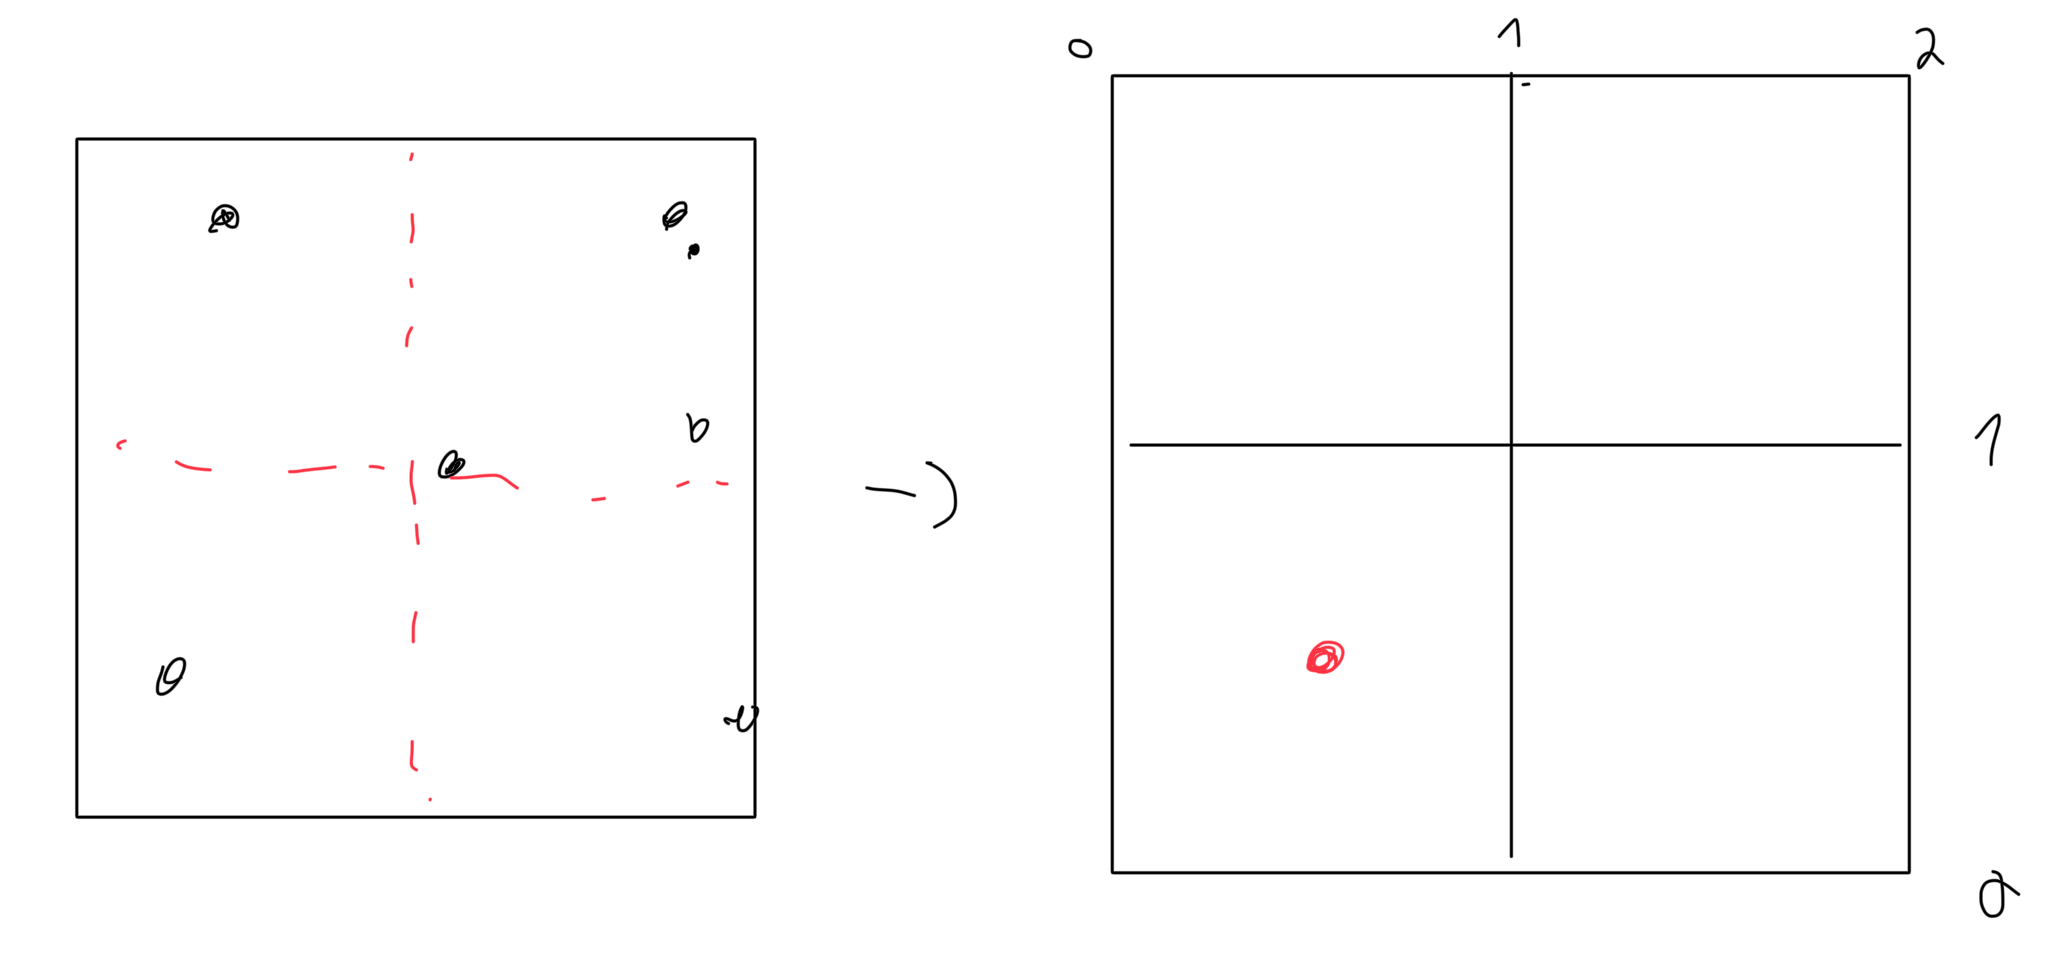
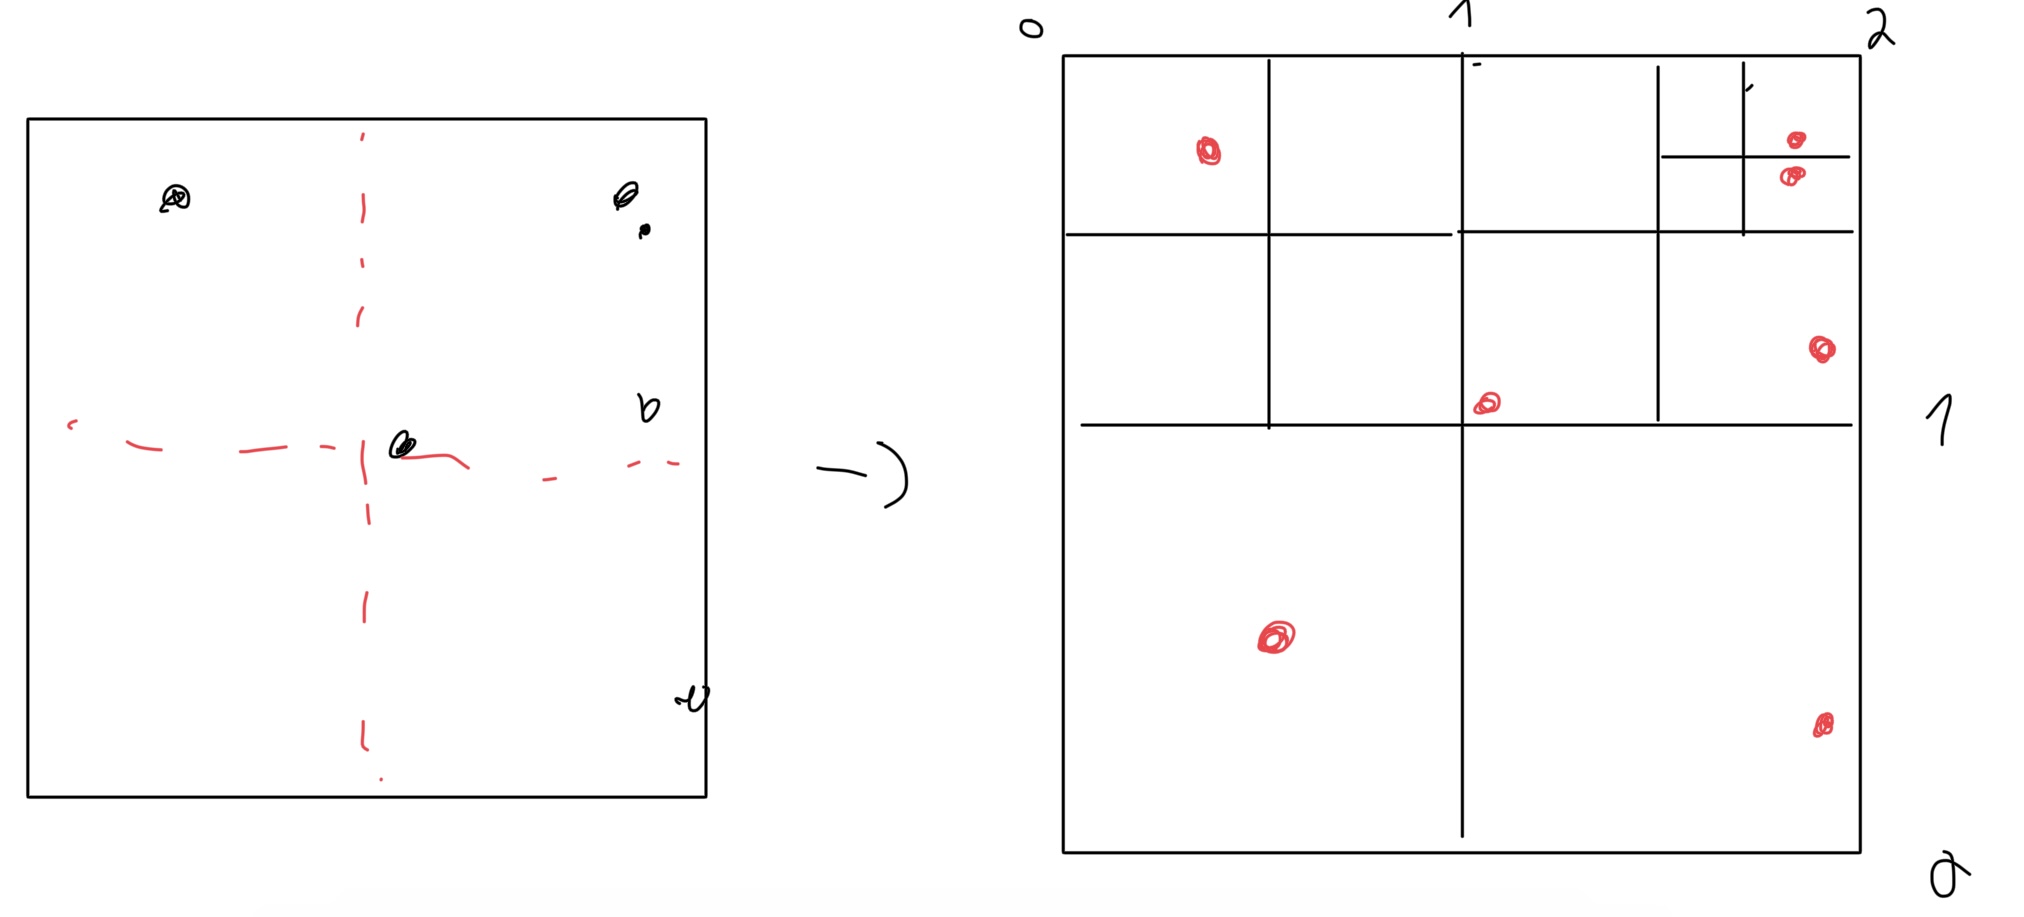
O(log(n))as opposed toO(n). It might seem like a minor improvement for a single user, but when you scale it up for multiple clients, the efficiency gains are massive.Implementation: We already know the Belgium border coordinate and we can also enlarge it a bit for all the stops to fit in even cross border one. The principle is not really hard, we divide our map in 4 sub maps and we do it recursively until we have a maximum of 4 stops in each sub map. Each node will contains its coordinate to make comparaison easier along with the stops it contains.


After running some test and tweaking the max number of stops per node, we ended up with a quadtree that took on average 2µs to find a few bus stops to 100µs with even more while the naive method stuck with 400µs to 5ms. We can see that the quadtree is way more efficient than the naive method.
Pseudo code: If the code interests you, it's as simple as:
function insert(coord: Coordinate, new_value: T) returns boolean
  Set node to reference self

  loop infinitely
      If node has children then
          Determine the quadrant of coord within node.extent
          Based on the quadrant, set node to the respective child (bot_left, bot_right, top_left, top_right)

      else
          If node.value is None then
              Set node's value to new_value and coord
              break from loop

          Set (o_value, o_coord) to node's value

          If setting node's value to new_value and coord is successful then
              break from loop

          Divide the node into quadrants

          Determine the quadrant of o_coord within node.extent
          Based on the quadrant, set new_node to the respective child (bot_left, bot_right, top_left, top_right)

          Set new_node's value to (o_value, o_coord)
          Set node's value to None

      return true
  end function
function find_bbox(extent) Initialize an empty list 'result' Initialize an empty stack 'stack' Push 'self' onto 'stack' While 'stack' is not empty Pop the top element from 'stack' into 'node' If 'node's extent intersects with 'extent' If 'node' has a value Add the data of 'node' to 'result' If 'node' has children For each child of 'node' ('bot_left', 'bot_right', 'top_left', 'top_right') If child exists Push child onto 'stack' Return 'result' end functionBut Why?: You might be thinking, "Is a quadtree really necessary for just 32k stops (roughly 2mb of data)?" Technically, no. Sending the entire file once could have been just as effective. But here's the thing: I had my sights set on implementing this quadtree from the get-go. It's not just about this specific case; it's about setting the groundwork for more complex tasks in the future. Plus, it's a cool tech challenge, isn't it?
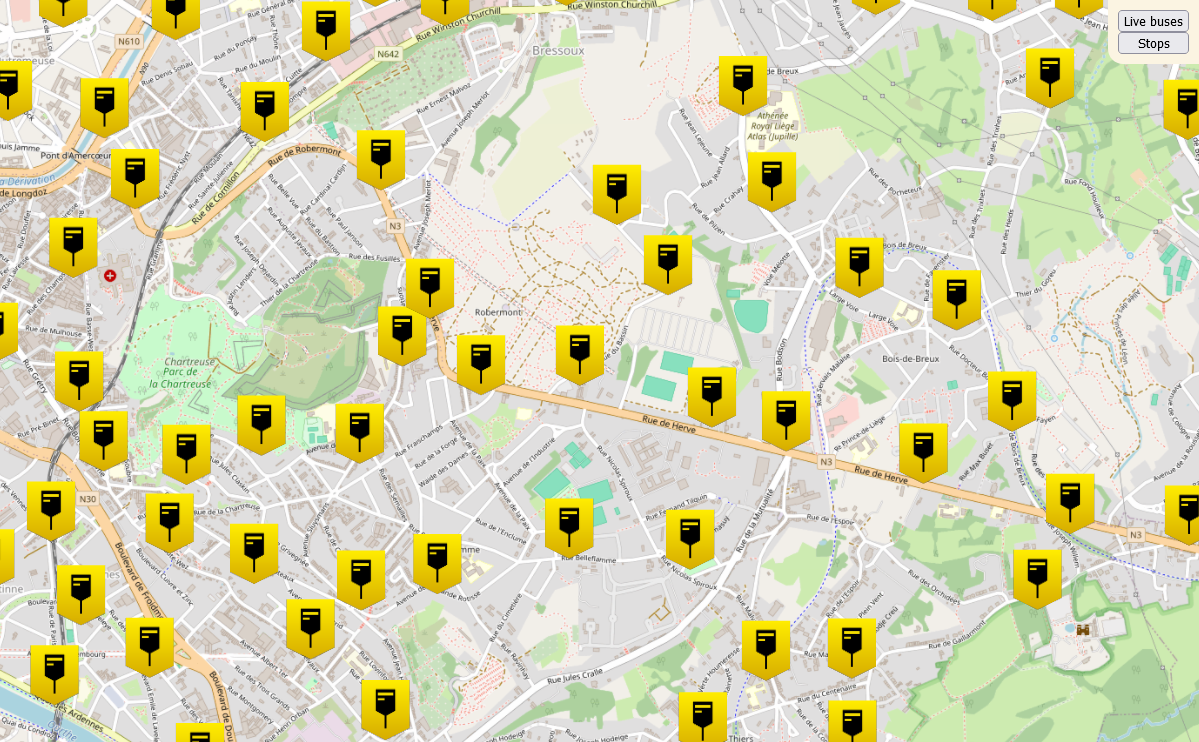
The Result: Now we can either select live buses or show stops. But hey, maybe adding data when we click on stops right?

You'll also notice that the stops are evenly distributed. This is where the
Superclusterlibrary comes into play. It's a fantastic tool that helps to reduce the total number of bus stops displayed at once by clustering them based on the zoom level. This not only makes the map more readable but also significantly improves performance by avoiding overcrowding with too many markers.
Second Challenge: Getting Buses Per Stop
The Strategy: The next hurdle was figuring out how to display buses that are due or have already passed each stop. My initial thought? Iterate over all buses and check if their line passes through the stop whenever someone requests bus information. But, there's a more efficient way! Using the GTFS files right from the start, we map each stop with the lines that pass through it in a hash map. This approach means we don't have to iterate over all buses each time someone makes a request. It's a neat
O(1)operation.Library to the Rescue: While Rust's
HashMapis pretty solid, I wanted something with higher throughput. Enterahash– it's the perfect fit for this use case, offering the speed and efficiency we need.Result :

Some Fixes!
Accurate Time Calculations: There was a little hiccup with the time computation for buses. Turns out, a bit of my own laziness led to some inaccuracies. After some tweaks and the implementation of a few overlooked aspects, the timing is now spot on.
Client-Side Computing: You might be wondering why all this computation is happening client-side, especially since this blog series is all about creating an analysis tool. The answer? Simplicity and immediacy. Implementing these features in the browser allows for asynchronous updates and immediate feedback, without the need for constant recompiling. Rest assured, all this client-side computing will eventually be integrated server-side for the final part.